Synthetic Testing & Performance
Testing was performed at stock settings except for system memory which had its XMP profile applied.
Futuremark 3DMark
3DMark includes everything you need to benchmark your PC and mobile devices in one app. Whether you’re gaming on a smartphone, tablet, notebook, or a desktop gaming PC, 3DMark includes a benchmark designed specifically for your hardware.
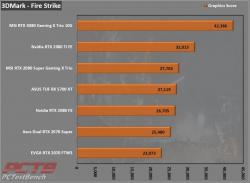
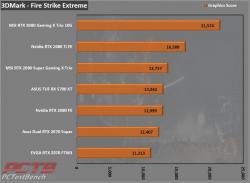
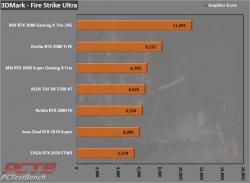
MSI’s RTX 3080 Gaming X Trio 10G makes good use of the new Nvidia Ampere and puts even the previous flagship 2080Ti to shame by a wide margin at every level of Fire Strike.
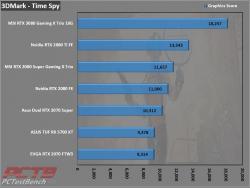
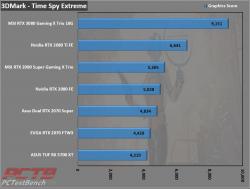
The trend continues in Time Spy. We had to expand the scale on our charts, when we first entered the scores of the 3080, it went right off the side of the chart.
Port Royal
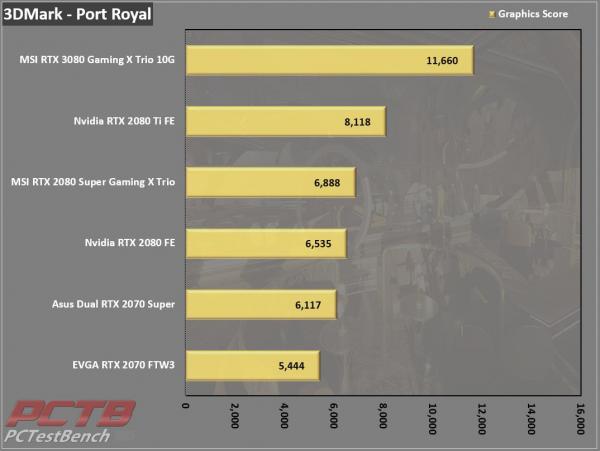
test and compare the real-time ray tracing performance of any graphics card that supports Microsoft DirectX Raytracing—including multi-GPU systems.
We can see that the RTX 3080 Gaming X Trio holds a commanding lead in ray tracing thanks to the new generation RT cores.
NVIDIA DLSS Feature Test
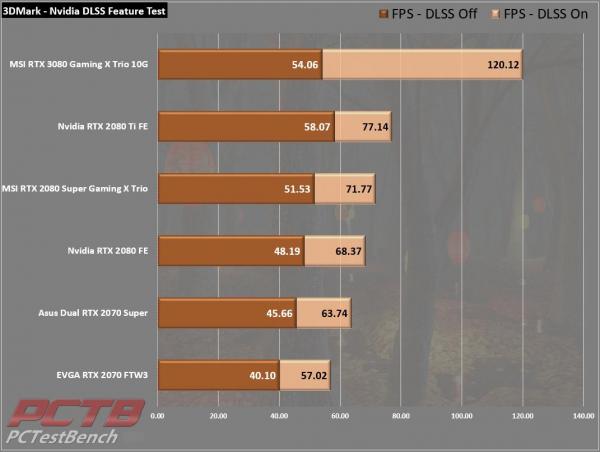
The NVIDIA DLSS feature test runs in two passes. The first pass renders Port Royal with DLSS disabled to measure baseline performance. The second pass renders Port Royal at a lower resolution then uses DLSS processing to create frames at the output resolution. The result screen reports the frame rate for each run
There isn’t much to say here. It’s obvious which card has the new generation Tensor cores, responsible for the DLSS magic sauce that is more than doubling the FPS here.
3DMark – VRS Feature Test
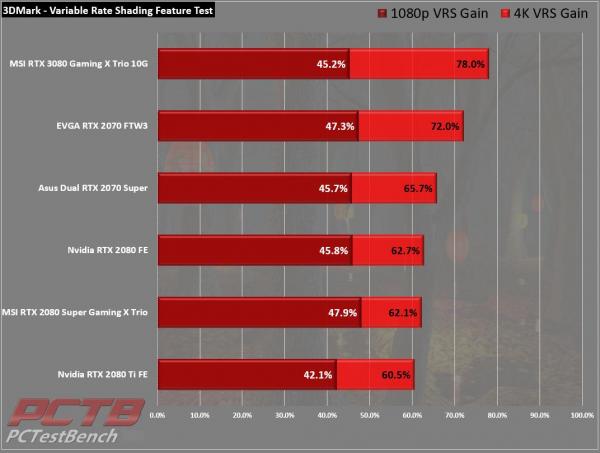
The 3DMark VRS feature test is designed to help you compare differences in performance and image quality when using variable-rate shading. The test also offers an interactive mode for experimenting with different VRS settings and exporting frames for comparison.
The RTX 2070 does surprisingly well here due to its lower overall horsepower and every pixel it doesn’t have to process helps, but the real star is the RTX 3080 Gaming X Trio which sees spectacular gains at 4K resolution.
Futuremark VRMark
The performance requirements for VR games are much higher than for typical PC games. So if you’re thinking about buying an HTC Vive or an Oculus Rift, wouldn’t you like to know that your PC is ready for VR?
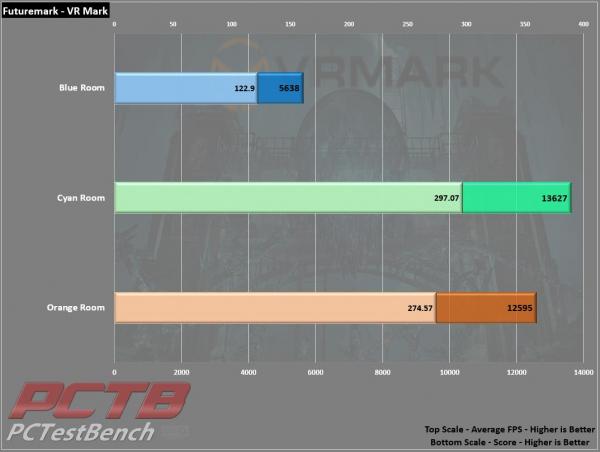
VRMark includes three VR benchmark tests that run on your monitor, no headset required, or on a connected HMD. At the end of each test, you’ll see whether your PC is VR ready, and if not, how far it falls short.
Orange Room Test – The Orange Room benchmark shows the impressive level of detail that can be achieved on a PC that meets the recommended hardware requirements for the HTC Vive and Oculus Rift. If your PC passes this test, it’s ready for the two most popular VR systems available today.
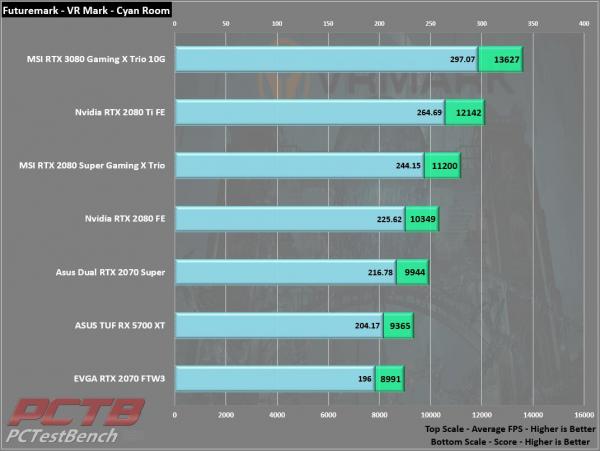
Cyan Room Test – Cyan Room is a DirectX 12 benchmark. It features a large, complex scene and many eye-catching effects. Cyan Room shows how using an API with less overhead can help developers deliver impressive VR experiences even on modest PC systems.
Blue Room Test – The Blue Room is a much more demanding test. It’s ideal for benchmarking the latest graphics cards. With its massive 5K rendering resolution and spectacular volumetric lighting effects, the Blue Room sets the bar for future hardware generations.
MSI’s 3080 Gaming X Trio is the first card we’ve tested to clear the Blue target of 109 FPS with the 2080Ti hitting right at 100FPS average and the 3080 scoring well over 120 FPS.
As expected, the 3080 Gaming X Trio holds a comfortable margin over every previous card.
Unigine Superposition
Extreme performance and stability test for PC hardware: video card, power supply, cooling system. Check your rig in stock and overclocking modes with a real-life load! Also includes interactive experience in a beautiful, detailed environment.
A lone professor performs dangerous experiments in an abandoned classroom, day in and day out. Obsessed with inventions and discoveries beyond the wildest dreams, he strives to prove his ideas.
Once you come to this place in the early morning, you would not meet him there. The eerie thing is a loud bang from the laboratory heard a few moments ago. What was that? You have the only chance to cast some light upon this incident by going deeply into the matter of quantum theory: thorough visual inspection of professor’s records and instruments will help to lift the veil on the mystery.
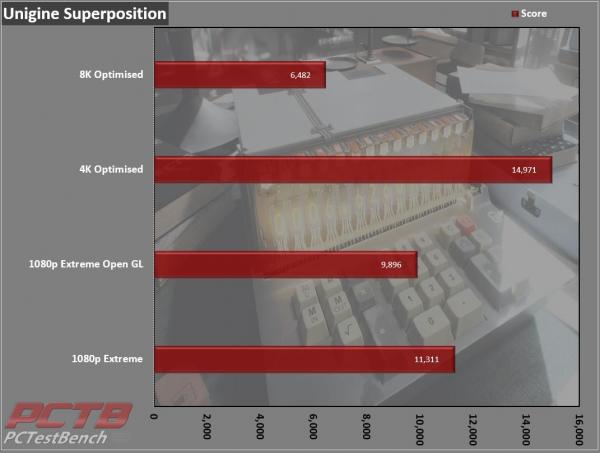
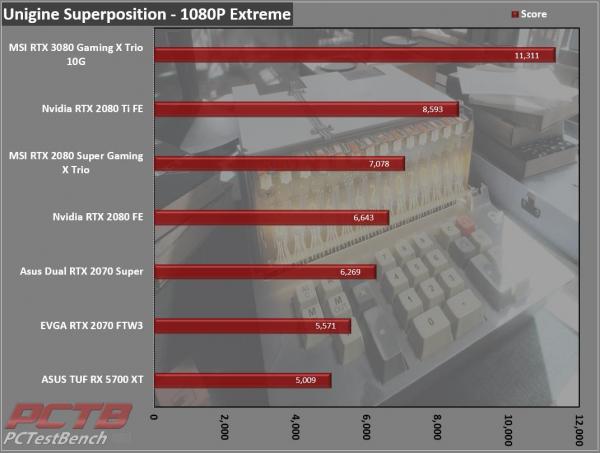
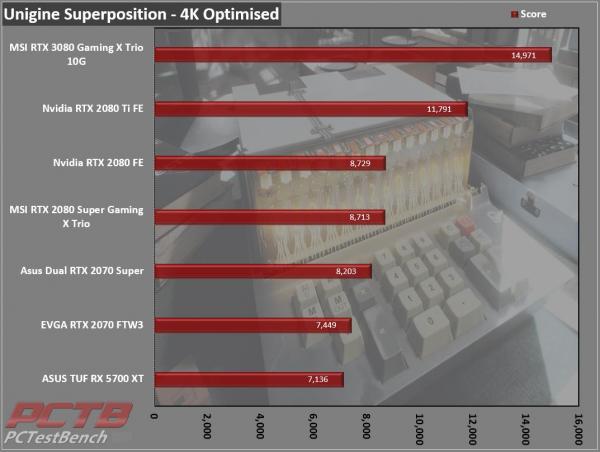
These scores are off the charts! Well, they were, we did have to adjust the chart here too. It’s obvious that this is comfortably a single card 4K solution.
Two years ago, we were impressed that the RTX 2080Ti broke the 8K mark in 1080p with Extreme settings, this year, the RTX 3080 blew the doors off 11,000.
Almost 15 thousand points in 4K optimized… good grief Charlie Brown!
Passmark Performance Test – GPU Mark 3D
“Fast, easy to use, PC speed testing, and benchmarking. PassMark Performance Test ™ allows you to objectively benchmark a PC using a variety of different speed tests and compare the results to other computers.”
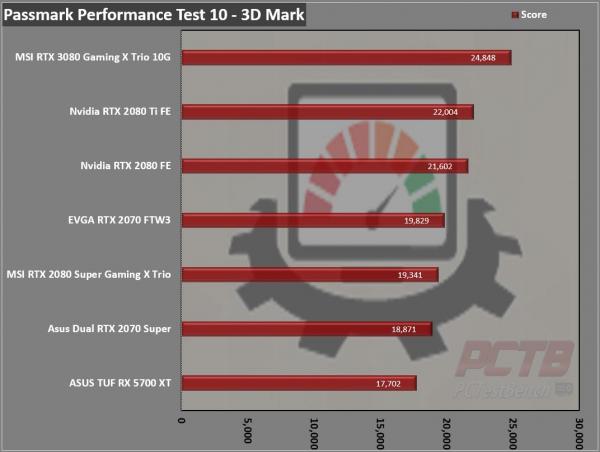
Passmark’s Performance Test 10 can test many aspects of a system. As we aren’t really worried about 2D workloads with a flagship gaming card, we checked out the 3D Mark overall test and got a score only a few points short of 25k.
Blender Benchmark 2.90 – BMW27
A new platform to collect and display the results of hardware and software performance tests. Aimed at an optimal comparison between system hardware and installations using open source software and testing content in the public domain
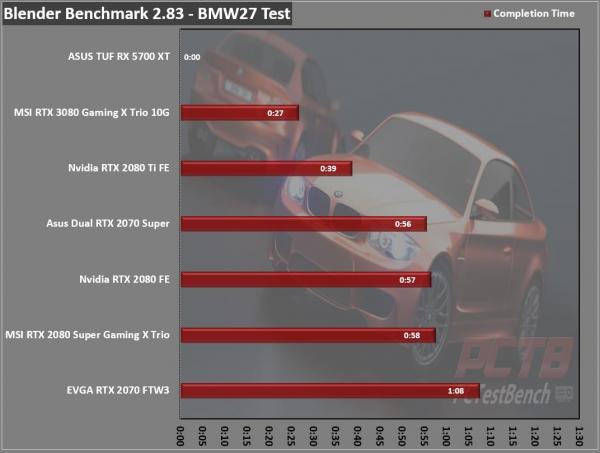
MSI’s RTX 3080 Gaming X Trio just decimates here, finishing the BMW render in less than half the time of the RTX 2080/Super, and still significantly faster than the RTX 2080Ti. Our AMD card just flat refused to run this test in OpenCL mode for some reason, hence the zero time.
