Synthetic Benchmarks
3DMark
3DMark is the go-to benchmark for all enthusiasts. It covers tests for everything from tablets and notebooks to gaming laptops and the most powerful gaming machines. For this review, we ran both Time Spy Extreme and Fire Strike Ultra. For the synthetic benchmarks, we still run each benchmark three times. However, we just go with the best overall results out of the three, we do not average them out.
Time Spy
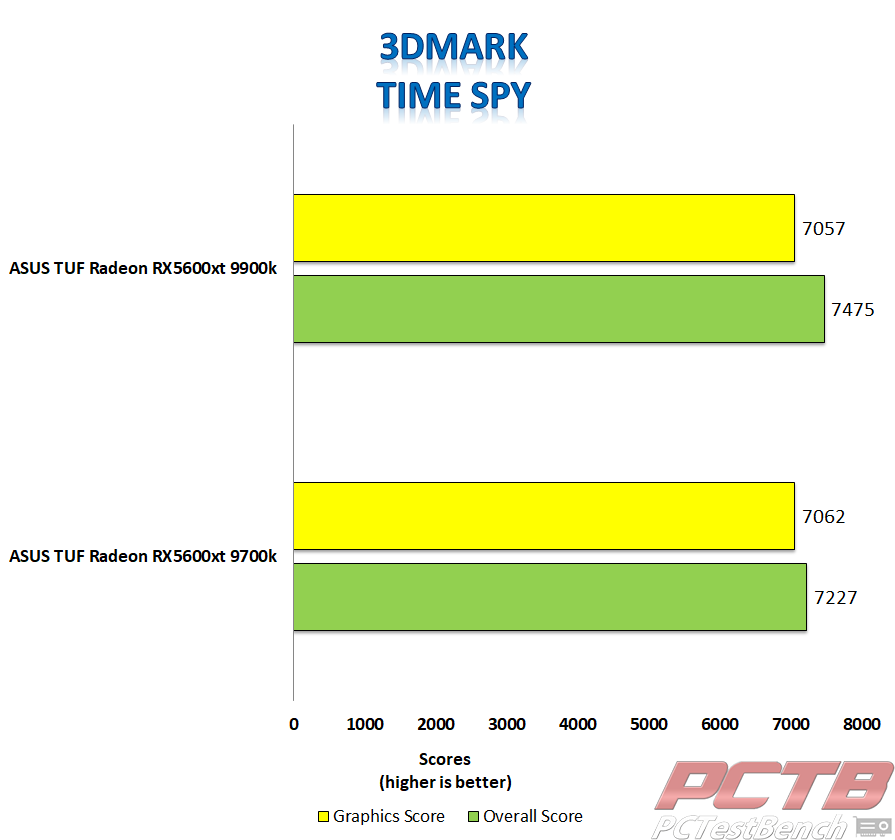
In 3DMark Time Spy, our ASUS TUF 5600 XT achieved a higher overall score on the i9 9900k system. However, the TUF 5600 XT had a slightly higher score on the i7 9700k system. On the i9 9900k system, the TUF 5600 XT achieved an overall score of 7475 and a graphics score of 7057. On our 9700k system, the TUF 5600 XT achieved an overall score of 7227 and a graphics score of 7062.
Firestrike
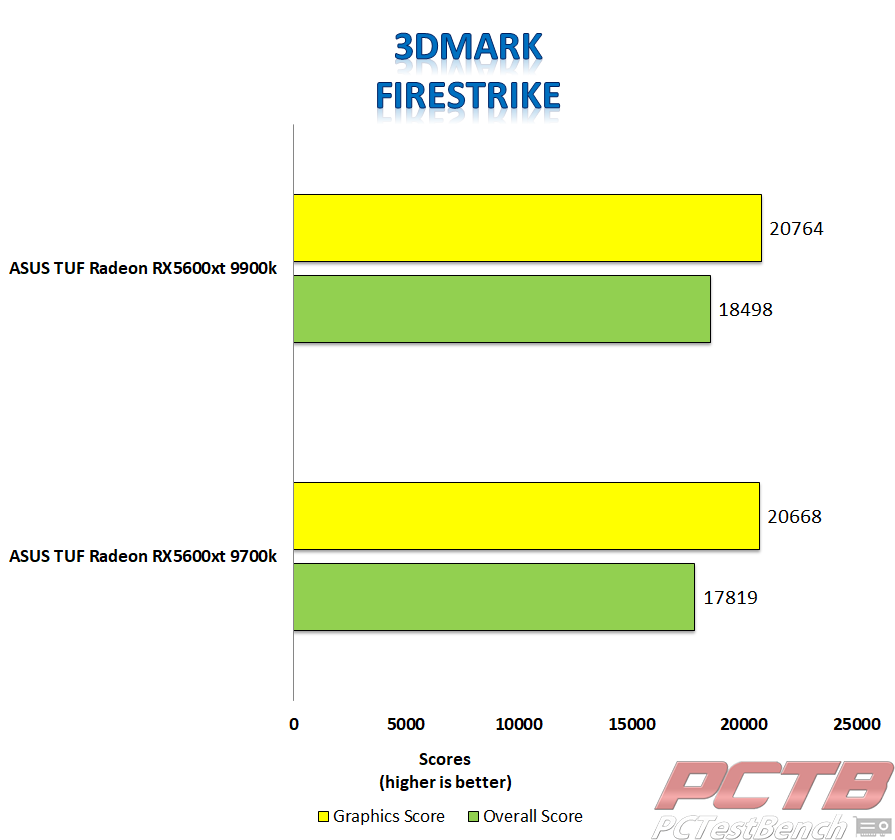
In 3DMark Firestrike, the ASUS TUF 5600 XT did better in both the overall score, as well as the graphics score on our i9 9900k system. On the 9900k system, the ASUS TUF 5600 XT achieved an overall score of 18498 and a graphics score of 20764. On the i7 9700k system, the ASUS TUF 5600 XT had a graphics score of 20668 and an overall score of 17819.
VRMARK
VR Mark consists of three separate tests, each more intensive on your system than the last. These tests are The Orange Room, the Cyan Room, and the Blue Room. The Orange Room test is the least intense and is meant to test a system that meets the minimum hardware requirements for VR Gaming. The Cyan Room shows the user how the use of an API with less overhead can provide the user with a great VR experience, even on less than amazing hardware. The Blue Room test is designed for the latest and greatest hardware. The Blue Room renders at a whopping 5K resolution and is designed to push your system to the limits for an amazing VR experience.
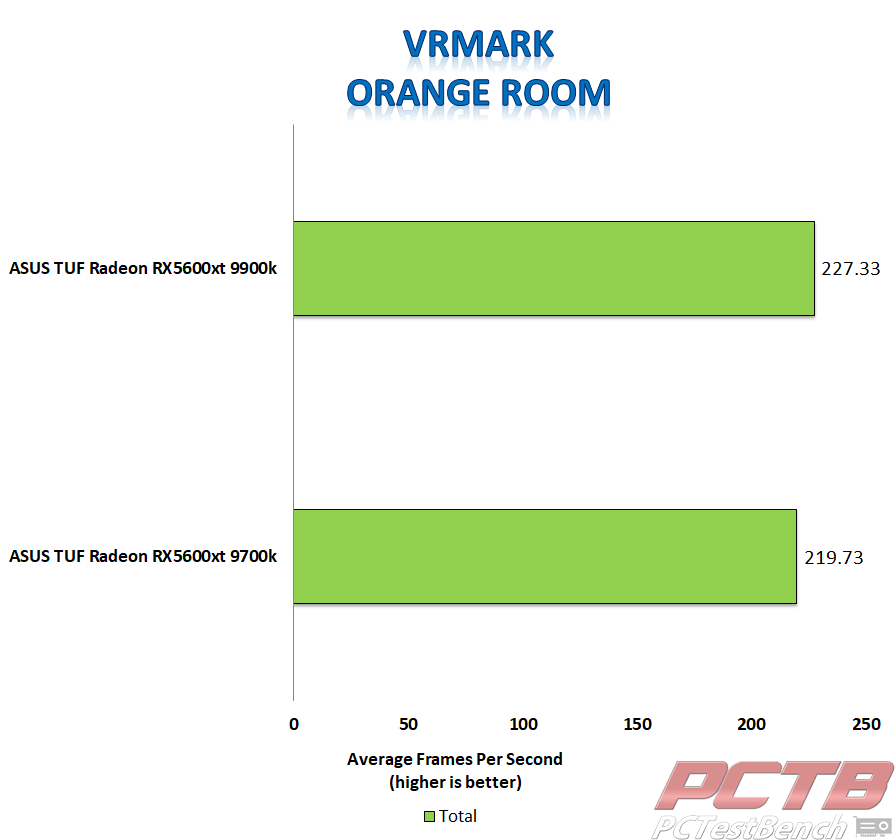
VRMark Orange Room is the least graphically intensive of the VRMark benchmarks. The target frame rate of the Orange Room benchmark is 88.9 frames per second. The rendering resolution for the Orange Room benchmark is 2264 x 1348 This is designed to meet the frame rate of a PC that meets the recommended specifications of HTC Vive and the Oculus Rift. In VRMark Orange Room, the ASUS TUF 5600 XT achieved an overall score of 10423 on our i9 9900k test bench and an average frame rate of 227.33 frames per second. On our i7 9700k test bench, the TUF 5600 XT achieved an overall score of 10080 and an average frame rate of 219.73 frames per second.
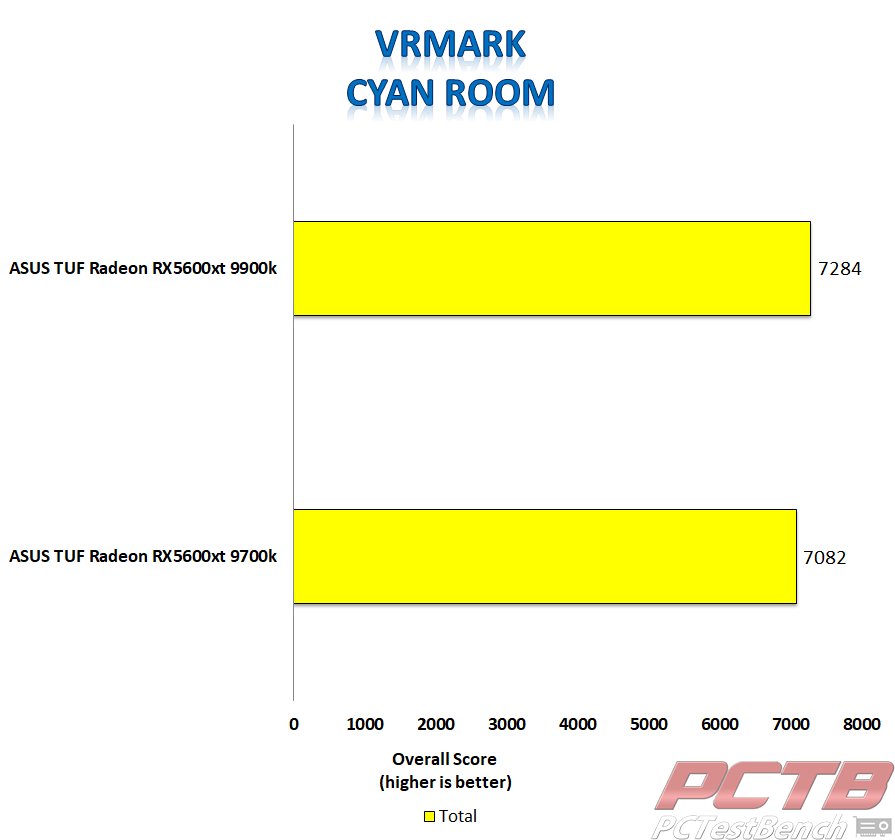
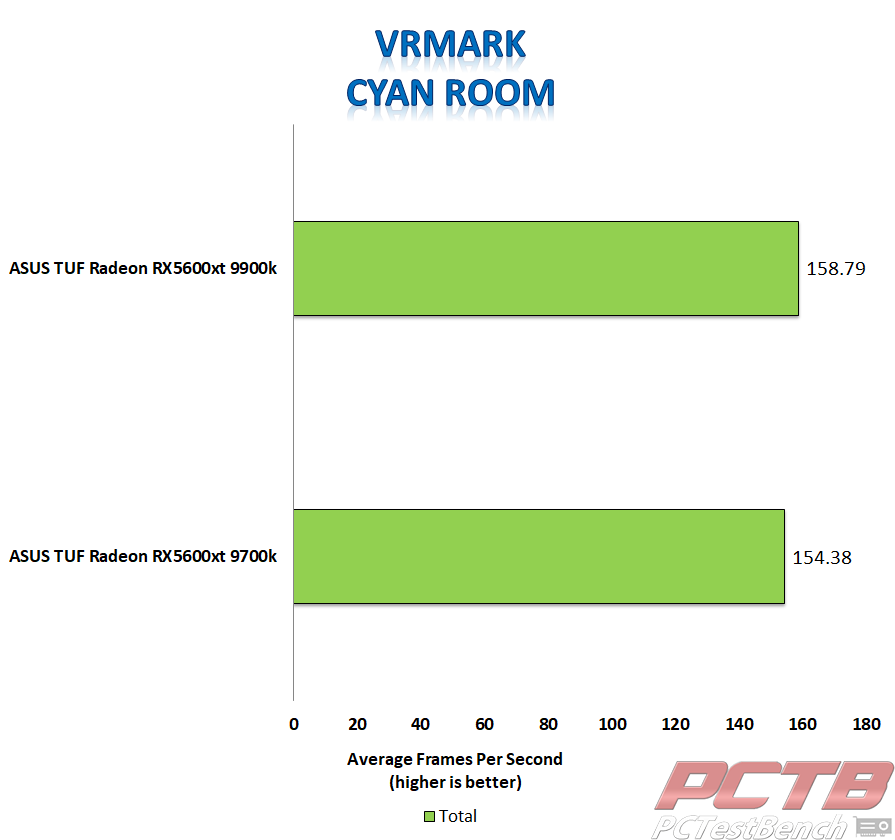
VRMark Cyan Room is a DX12 benchmark for testing virtual reality. Graphically, the Cyan Room benchmark is placed between the Orange Room and Blue Room benchmarks. The target frame rate of the Cyan Room benchmark is 109 frames per second. The rendering resolution for the Cyan Room benchmark is also 2264 x 1348 This is designed to meet the frame rate of a PC that can maintain a minimum frame rate of 90 FPS running the Cyan Room Benchmark in HMD mode. In VRMark Cyan Room, the ASUS TUF 5600 XT achieved an overall score of 7284 on our 9900k test bench and an average frame rate of 158.79 frames per second. On our 9700k test bench, the TUF 5600 XT achieved an overall score of 7082 and an average frame rate of 154.38 frames per second.
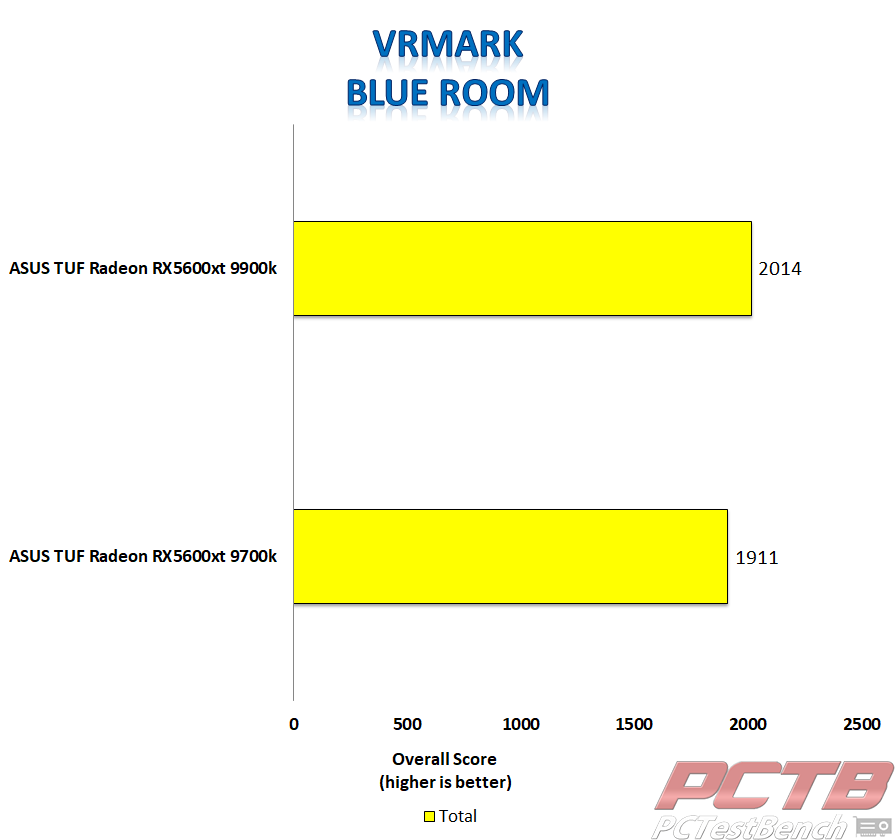
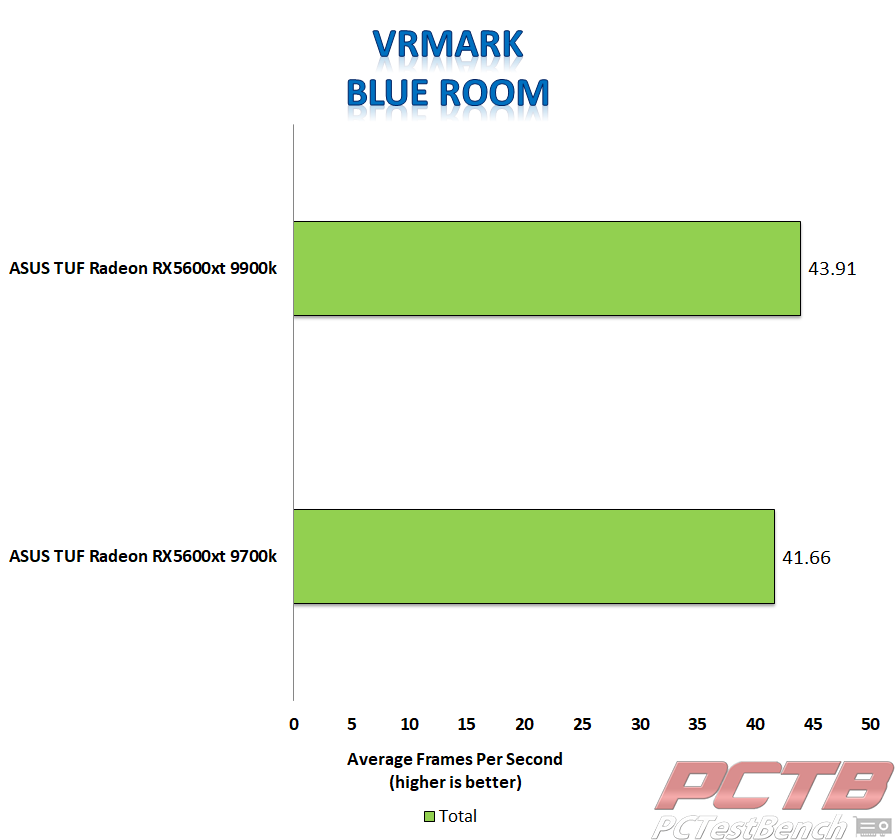
VRMARK Blue Room is the most graphically intensive benchmark in the VRMARK suite with a rendering resolution of 5k to 5120 x 2880 to be exact. The target frame rate of the Blue Room benchmark is the same as the target frame rate for the Cyan Room Benchmark, 109 frames per second. The Blue Room Benchmark is designed to meet the frame rate of a PC that can maintain a minimum frame rate of 90 FPS running the Blue Room Benchmark in HMD mode. In VRMARK CyanRoom, the ASUS TUF 5600 XT achieved an overall score of 2014 on our 9900k test bench and an average frame rate of 43.91 frames per second. On our 9700k test bench, the TUF 5600 XT achieved an overall score of 1911 and an average frame rate of 41.66 frames per second.
Unigine Superposition
Superposition is another GPU intensive benchmark put out by Unigine, the makers of both the very popular Valley and Heaven benchmarks. Superposition is an extreme performance and stability test for graphics cards, power supplies, and cooling systems. For this review, we ran all five benchmark settings in Unigine Superposition. These settings are 1080p Medium, 1080p High, 1080p Extreme, 4k Optimized and 8k Optimized. These tests were run on both the I9-9900k test bench and the I7-9700k test bench.
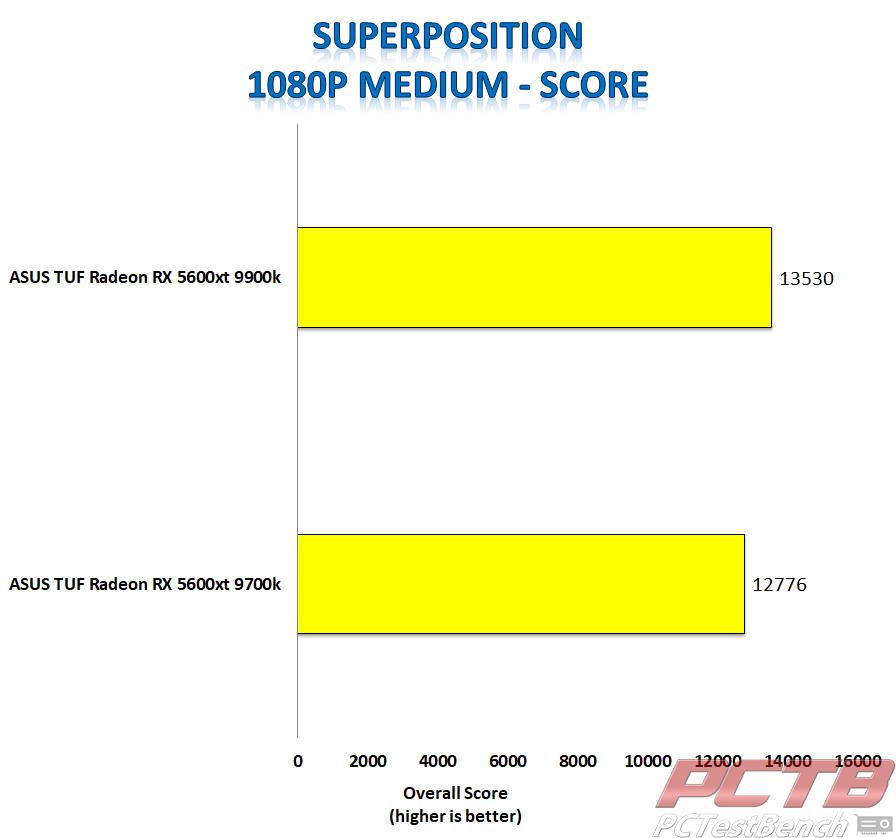
In Unigine Superposition’s 1080p Medium test, the ASUS TUF 5600 XT achieved a better overall score on the I9-9900k test bench. The TUF 5600 XT scored 13530 on our 9900k system and a score of 12776 on our 9700k system on the 1080p Medium settings.
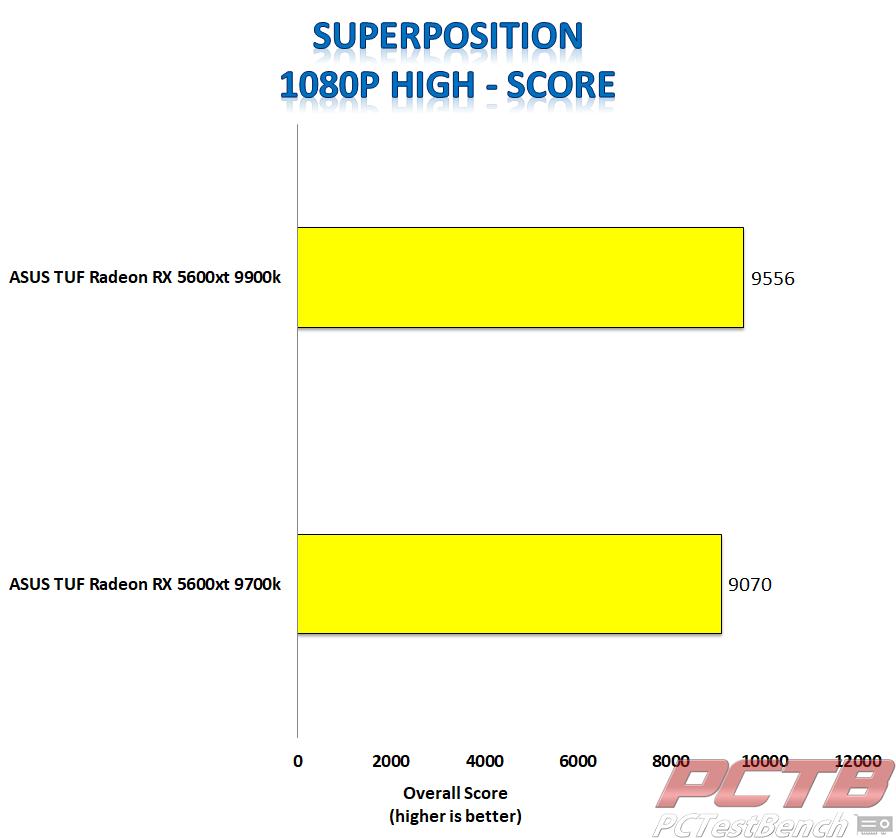
In Unigine Superposition’s 1080p High test, the ASUS TUF 5600 XT again achieved a better overall score on the I9-9900k system. The TUF 5600 XT scored 9556 on our 9900k test bench and a score of 9070 on our 9700k system on the 1080p High settings.
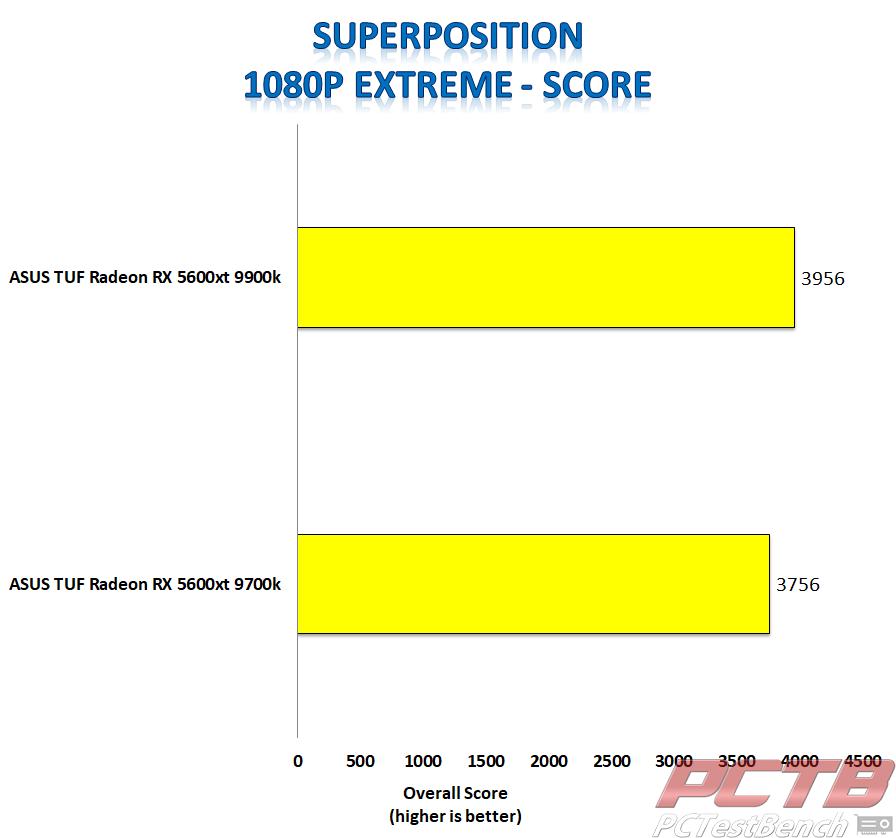
We start to see a trend on Unigine Superposition’s 1080p Extreme test, as once again the ASUS TUF 5600 XT achieved a better overall score on our i9-9900k test bench. The TUF 5600 XT scored 3956 on our 9900k system and a score of 3756 on our 9700k system on the 1080p Extreme settings.
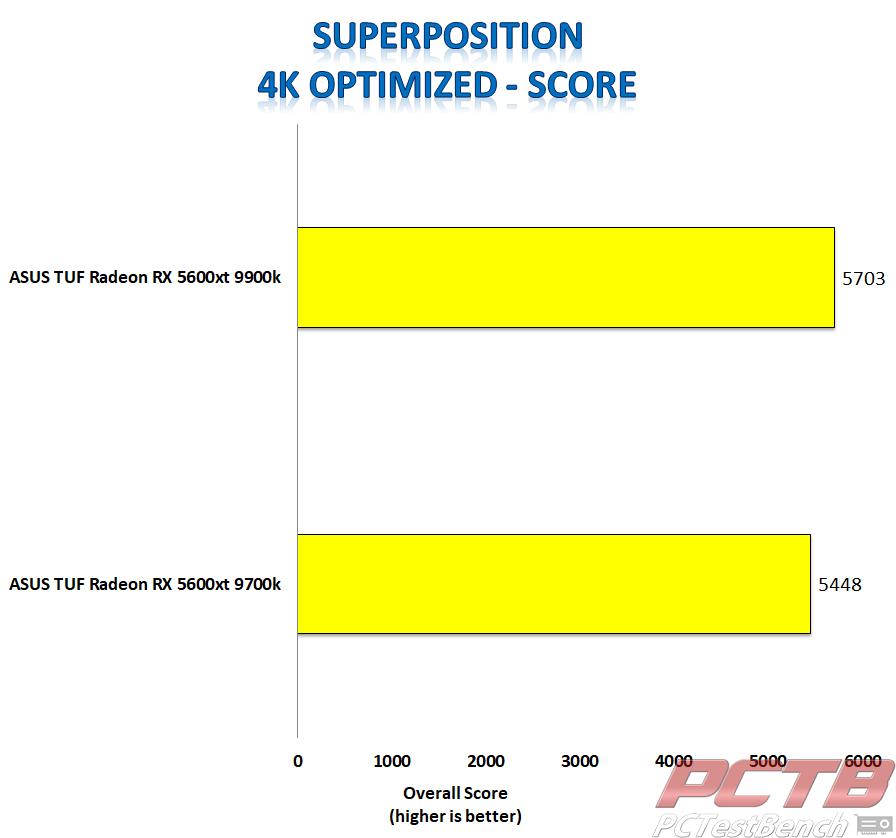
In Unigine Superposition’s 4k Optimized test, the ASUS TUF 5600 XT continued to achieve higher scores on our 9900k test bench. The TUF 5600 XT scored 5703 on our 9900k test bench and a score of 5448 on our 9700k test bench on the 4k Optimized settings.
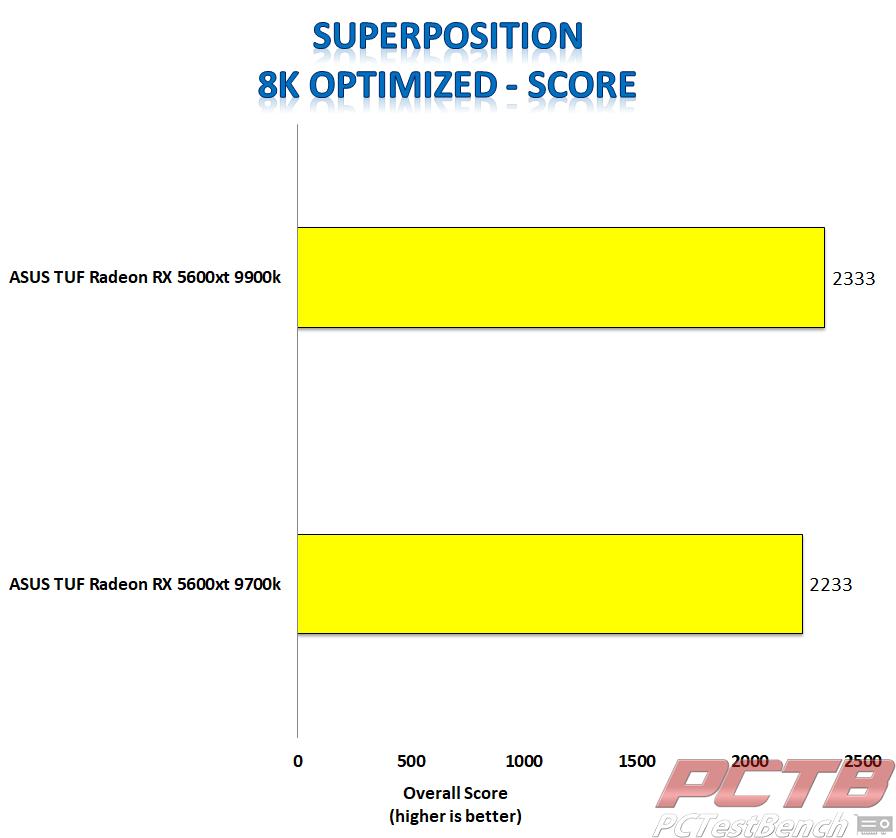
The Last test in Unigine Superposition is the 8k Optimized Test. Like the other four Superposition benchmarks, the ASUS TUF 5600 XT achieved a higher overall score on the 9900k test bench with a score of 2333. The TUF 5600 XT wasn’t too far behind that on the 9700k system with an overall score of 2233.
Unigine Heaven.
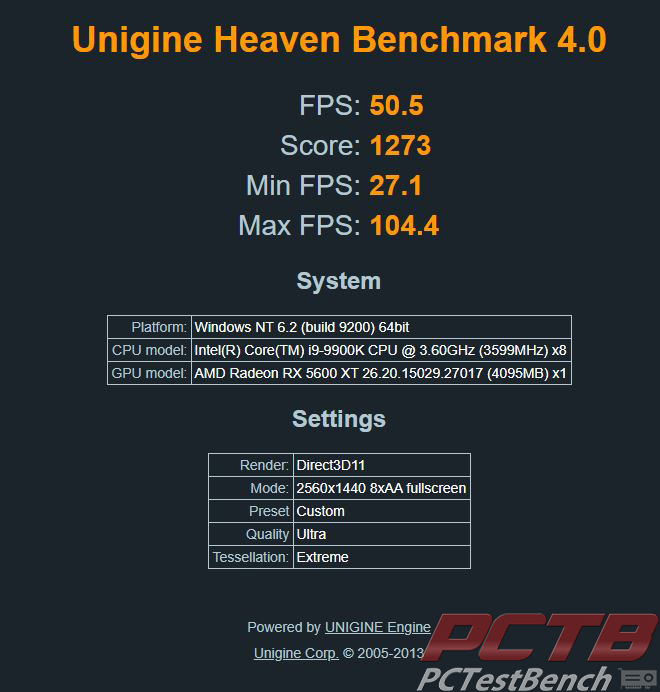
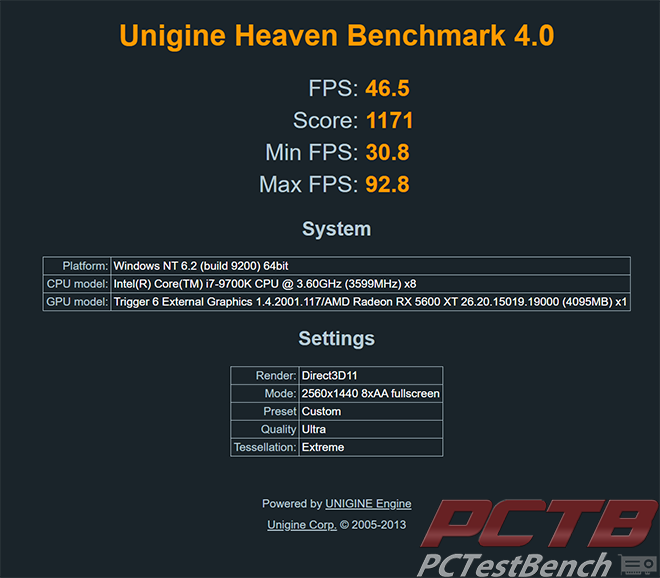
In Unigine’s Heaven Benchmark, The ASUS TUF 5600 XT did slightly better when paired with the Core i9-9900k. The overall score for the ASUS TUF 5600 XT on out standard test bench with the 9900k was 1273 The minimum frame rate on the 9900k system was 27.1, the maximum frame rate was 104.4 and the average frame rate was 50.5. On our 9700k test bench, the TUF 5600 XT achieved an overall score of 1171. The minimum frame rate was 30.8. the maximum frame rate was 92.8 and the average frame rate was 46.5.
