System Configuration & Testing
To test CARDEA IOPS we placed it on our open-air teat bench with the following specifications:
- CPU: i9 9900K
- Motherboard: Gigabyte Z390 Aorus Pro
- RAM: 2 x 8GB Corsair Dominator Platinum RGB @ 3200MHz
- GPU: Gigabyte 2070 Super Gaming OC
- OS Drive: Crucial P1 1000GB
- OS: Window 10 Professional X64
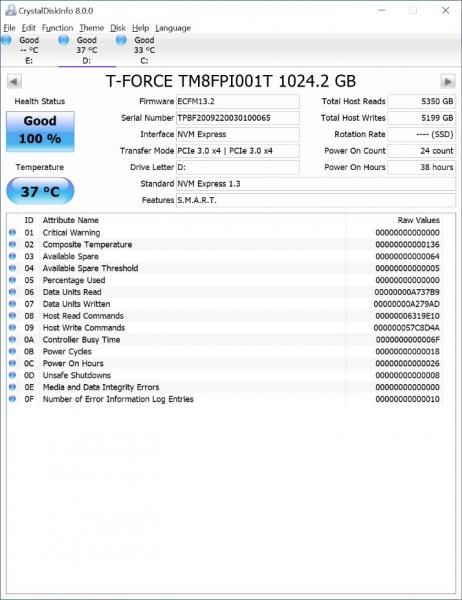
Like I do for all my drive benchmarking sessions, I use CrystalDiskInfo to check out some details of the CARDEA IOPS. We set up the CARDEA IOPS as a secondary drive and see it’s an NVMe 1.3 drive utilizing PCIe 3.0 x4.
I will be running the drive through various benchmarking applications to see how it fairs under different workloads. These applications include:
- ATTO Disk Benchmark
- CrystalDiskMark 6.0
- Anvil’s Storage Utilities
- AS SSD
ATTO Disk Benchmark
“As the industry’s leading provider of high-performance storage & network connectivity products, ATTO has created a widely-accepted Disk Benchmark freeware utility to help measure storage system performance. As one of the top tools utilized in the industry, Disk Benchmark identifies performance in hard drives, solid-state drives, RAID arrays as well as connections to storage. Top drive manufacturers, like Hitachi, build and test every drive using the ATTO Disk Benchmark”
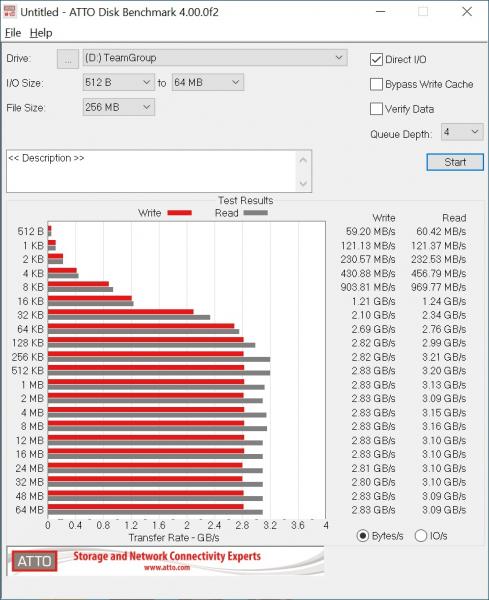
In the ATTO benchmark, it performed as expected with the number scoring just below the rated speed with 3210MBs read and 2830MBs write.
CrystalDiskMark 6.0
“CrystalDiskMark is designed to quickly test the performance of your hard drives. Currently, the program allows measuring sequential and random read/write speeds.”
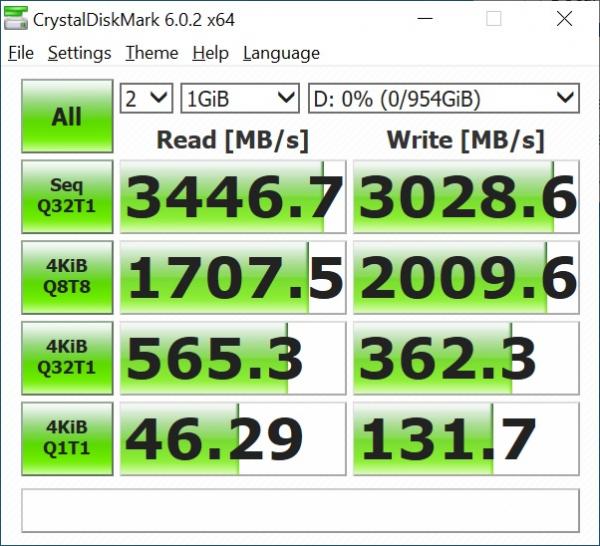
In CrystalDiskMark benchmark the CARDEA IOPS posts a picture-perfect score with read/write speeds of 3446/3028MBs.
Anvil’s Storage Utilities
Anvil’s Storage Utilities has been designed to be the most comprehensive benchmark tool for Solid State Drives on the market. That does not mean that you can’t use it for conventional platter-based drives as well, but you do get the most out of the program when you test the speed and performance of SSDs with it. The program has gone through a series of beta and release candidate builds already and is currently available as Release Candidate 3. It is usually linked from this forum thread, which currently is not the case for the RC build which you can download here directly. You can’t use previous builds as they are set to expire automatically.
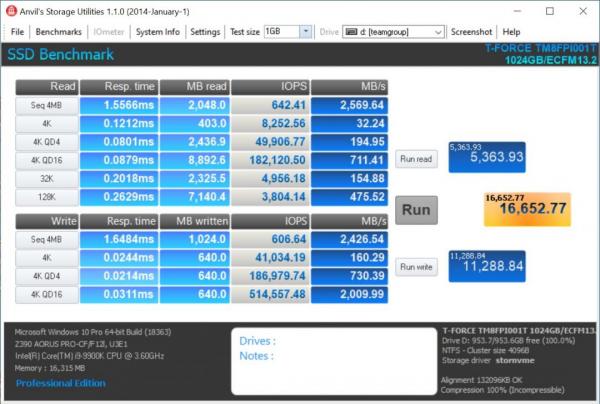
In Anvil we see the sequential read speed lower than expected but this quite normal for this benchmark. Looking at the IOPS we did notice it was about 150K short of the advertised speeds which were a little surprising. Though it’s possible Anvil also posts lower IOPS scores as we see in the read/write speeds.
AS SSD
The synthetic tests determine the sequential and random read and write performance of the SSD. These tests are carried out without using the operating system cache. In Seq-test the program measures how long it takes to read a 1 GB file to write respectively. 4K test the read and write performance is determined at random 4K blocks. The 4K-64 corresponds to the test Third 4K procedure except that the read and write operations are distributed to 64 threads. This test should SSDs pose with Native Command Queuing (NCQ), differences between the IDE operation mode where NCQ is not supported, and the AHCI mode. The additional compression test can measure the power of the SSD in response to the compressibility of the data. This is especially for the controllers that use to increase the performance and life of the cell compression, important.
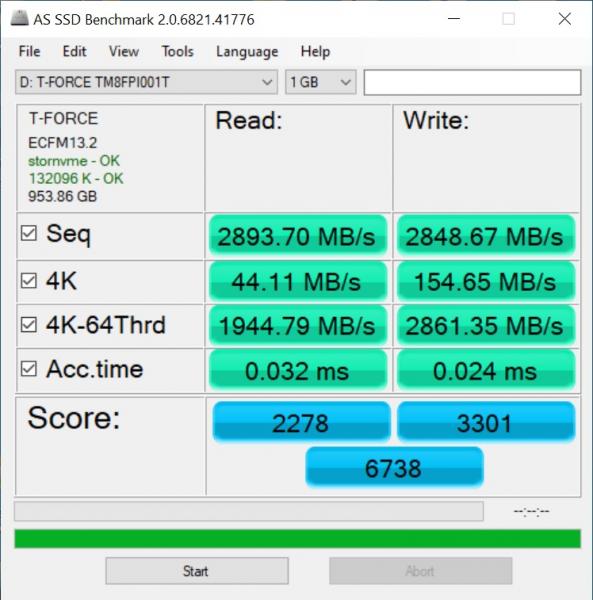
As expecting the SEQ speeds in the AS SSD benchmark are slightly lower than the rated 3400/3000MBs read/write with speeds of 2893/2848MBs.
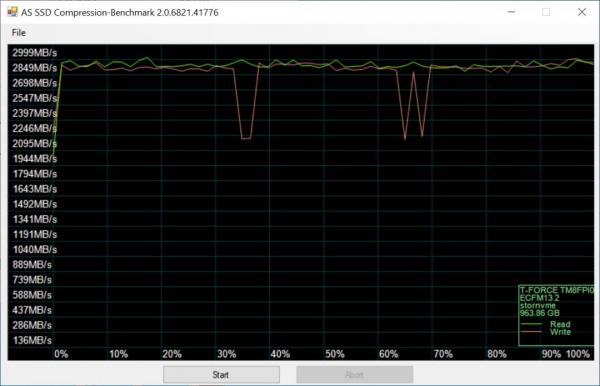
Looking at AS SSD compression benchmark we see a steady read speed of around 2850MB/s and write speed of 2350 MB/s with 2 drops to about 2100 MB/s.
After we ran all the benchmarks, we also did some temperature testing for each of the included heatsinks. We ran the stress tests using the following three configurations:
- Graphene Heatsink
- Aluminum Heatsink
- Motherboard M.2 Heatsink
Regardless of the applied heatsink, the drive idled a little above room temperature at 24C. When we ran the CARDEA IOPS with the aluminum heat spreader and motherboard heatsink, we reached a top temperature of 49C. With the graphene heat spreader installed we seen an increase of 11C with a top temperature of 60C. This is a little higher than expected but still well within its operating temperatures.
